
Bounce Rate Calculator
Bounce Rate Result
Informations Bounce Rate
The ability to comprehend the interaction of visitors with the website plays a crucial role in attaining success in the online world. A bounce rate calculator can be considered one of the most important tools needed in the domain of analytical tools for bounces in the context of website success, and its use can be considered critical for individuals and organizations operating in any of the domains of eCommerce businesses, blogs, and SaaS platforms.
Modern bounce rate tracking tools have evolved significantly, particularly with the transition from Universal Analytics to GA4. Today’s accurate bounce rate calculator options range from simple online calculators to advanced bounce rate analytics tools integrated with comprehensive marketing analytics platforms. This guide explores everything you need to know about bounce rate calculation, from basic formulas to industry benchmarks and optimization strategies.
What is Bounce Rate Calculator?
A bounce rate calculator is a specialized website engagement calculator designed to determine the percentage of visitors who leave your site after viewing only one page without taking any meaningful action. This digital analytics metrics tool processes session data to calculate the ratio of single-page sessions to total sessions, providing a numerical representation of visitor behavior.
The bounce rate calculator tool functions as both a diagnostic and strategic instrument. When someone arrives at your landing page, views the content, and exits without clicking through to additional pages, opening resources, or triggering events, that visit counts as a “bounce.” The calculator takes the total number of these single-interaction sessions and divides them by all sessions to generate the bounce rate percentage.
Modern website bounce rate calculators have adapted to accommodate different analytics platforms. The traditional bounce rate definition used in Google Analytics Universal differed from the engagement-based approach in GA4, where a “bounce” is now defined inversely through engagement rate. An SEO bounce rate calculator must account for these platform-specific nuances to provide accurate measurements.
Free bounce rate calculator options are widely available online, offering basic functionality for small businesses and individual website owners. These simple bounce rate calculator tools typically require manual input of session data. More sophisticated analytics bounce rate calculator solutions integrate directly with platforms like Google Analytics, providing real-time bounce rate calculations alongside other site performance metrics.
The best bounce rate calculator incorporates several advanced features. It should handle multiple traffic sources, distinguish between mobile and desktop sessions for mobile bounce rate calculator functionality, segment data by page type, and export results for further analysis. Professional-grade bounce rate software often includes predictive modeling, historical trend analysis, and benchmark comparisons across industries.
Understanding what counts as a bounce is essential for proper calculation. In traditional analytics, any single-page session without interaction constituted a bounce. Modern frameworks consider engagement signals—time on page exceeding a threshold (typically 10 seconds in GA4), scroll depth, video plays, downloads, or any tracked event. This evolution means that bounce rate vs engagement rate calculations now provide complementary rather than redundant information.
Bounce rate calculator for websites serves multiple purposes beyond simple measurement. It helps identify problematic pages with high abandonment, validates content effectiveness, measures landing page performance in paid campaigns, and signals potential technical issues affecting user experience. When used alongside tools like session duration calculator and page views per session calculator, it creates a comprehensive picture of visitor behavior.
How Does Bounce Rate Calculator Work?
The mechanics behind a bounce rate calculator involve processing visitor session data through a specific mathematical formula. The calculation process begins when analytics tracking scripts collect information about each website visit, recording entry points, exit points, page views, time stamps, and interaction events.
When a user lands on your website, the analytics tracking snippet initiates a session. This session tracking monitors whether the visitor navigates to additional pages, clicks internal links, submits forms, plays media, or triggers any custom events you’ve configured. If the visitor leaves without any of these interactions occurring, the session is flagged as a bounce.
The online bounce rate calculator aggregates this session level data across your chosen time period. It counts total bounced sessions (single-page visits with no engagement) and total sessions overall. The formula divides bounced sessions by total sessions, then multiplies by 100 to express the result as a percentage.
Different analytics platforms implement bounce tracking with varying sophistication. Basic bounce rate calculator tracking tools use simple page view counts. Advanced systems employ JavaScript-based event listeners that detect scroll depth, time thresholds, mouse movements, and content interaction. This is why bounce rate calculator GA4 implementations often show different results than older Universal Analytics—they’re measuring engagement differently.
Server side bounce rate calculation offers an alternative approach for sites requiring precise technical control. Rather than relying solely on client-side JavaScript, server logs track page requests and session continuity. This method proves particularly valuable for high-traffic sites where browser-based tracking might miss requests or when dealing with bot traffic that skews client-side analytics.
The site performance Bounce rate calculator aspect extends beyond simple percentage calculation. Quality bounce rate tools segment data by traffic source, device type, geographic location, and page category. An eCommerce bounce rate calculator might separate product pages from category pages and checkout flows, recognizing that acceptable bounce rates differ dramatically across these segments.
Real time bounce rate calculator functionality enables immediate performance monitoring. Marketing teams launching campaigns can watch how traffic responds to new landing pages. A/B testing frameworks use bounce rate data segmentation to compare design variations. User journey bounce rate analysis reveals where visitors disengage across multi-step processes.
The bounce rate calculator estimator component handles sampling for high volume sites. When millions of sessions occur daily, processing every single visit becomes computationally expensive. Statistical sampling techniques allow accurate estimates while maintaining processing efficiency. Predictive bounce rate modeling uses historical patterns and machine learning algorithms to forecast expected rates for new content or campaigns.
Integration capabilities separate basic from professional bounce rate software. The best tools connect with Google Data Studio, export to custom bounce rate report generators, feed data to AI bounce rate optimizer systems, and trigger alerts when thresholds are exceeded. A bounce rate API tool enables developers to build custom dashboards or incorporate bounce metrics into proprietary analytics platforms.
Custom bounce rate script implementations allow organizations to define “bounce” according to their specific business logic. A media site might consider a bounce only when time on page falls below 30 seconds, acknowledging that readers often consume articles without clicking further. A bounce rate calculator for small business might prioritize phone clicks and form submissions over page navigation, recognizing conversion happens through these interactions rather than multi-page browsing.
Bounce Rate Formula
The standard Bounce rate calculator is straightforward yet powerful in its application:
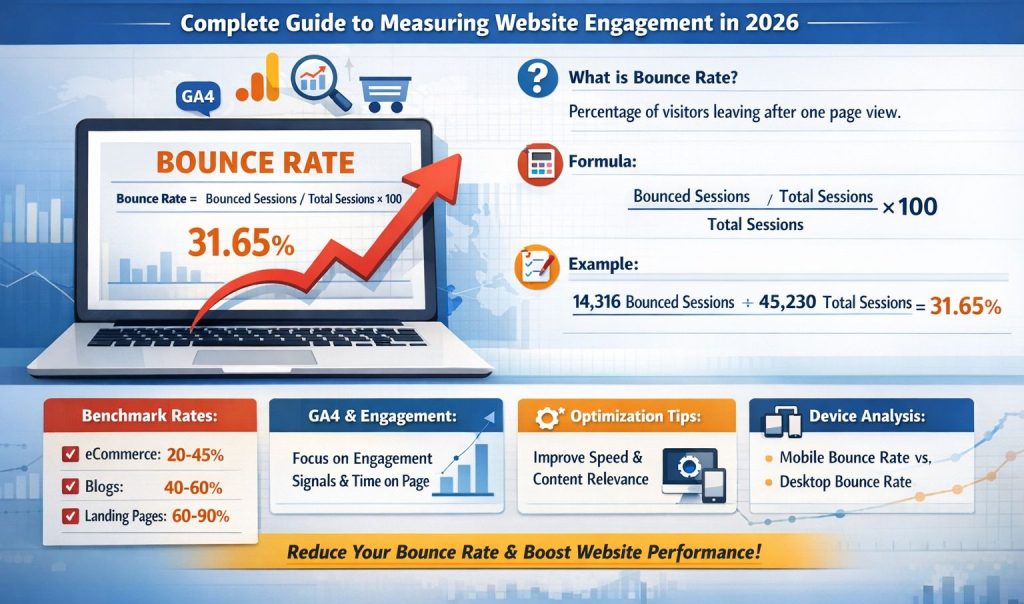
Bounce Rate = (Total Bounced Sessions ÷ Total Sessions) × 100
This bounce rate formula calculator expression represents the core calculation used across virtually all analytics platforms. Let’s break down each component:
Total Bounced Sessions refers to the count of visits where users viewed only a single page and took no tracked actions before leaving. These single-interaction sessions are identified by the absence of subsequent page views, event triggers, or engagement signals within the session timeframe.
Total Sessions encompasses every visit to your website during the measurement period, including both bounced and engaged sessions. A session typically expires after 30 minutes of inactivity, though this threshold can be customized in most analytics platforms.
The multiplication by 100 converts the decimal result into a percentage for easier interpretation and comparison. A result of 0.547 becomes 54.7%, indicating that slightly more than half of all visitors leave after viewing one page.
For more granular analysis, the formula can be adapted to specific segments:
Page-Specific Bounce Rate = (Bounces from Page X ÷ Total Entrances to Page X) × 100
This variation calculates bounce rate for individual pages rather than the entire site. “Entrances” refers to sessions where a particular page served as the entry point. This page bounce rate calculator approach identifies which landing pages perform well versus those driving visitors away.
Traffic Source Bounce Rate = (Bounces from Source Y ÷ Total Sessions from Source Y) × 100
Segmenting by traffic source reveals whether paid search, organic traffic, social media, or referrals deliver more engaged visitors. Marketing teams use this analytics bounce rate prediction to optimize channel investment and creative approaches.
Bounce rate calculator benchmarks vary radically depending on industry, content type, and traffic source. There is no single “good” rate; general guidelines place your metrics in perspective. Content websites and blogs usually have 40-60% bounce rates, because many visitors find what they’re looking for within a single article. eCommerce sites tend to average 20-45% due to the fact that product browsing requires multi-page navigation. The bounce rates of landing pages, being very campaign-specific, could fall in the range of 60-90%, because visitors convert right then and there or leave. High bounce rates are acceptable since conversion goals are usually achieved.
Service-based business sites typically have 30-50% because they’re giving equal weight to information and paths to conversion. News and media sites are anywhere between 40-70% depending on the depth of an article and how well the related content is presented. The dictionary, reference, and FAQ sites are naturally going to be high, at 60-80%, because users are visiting with a specific question and leaving once they have an answer.
Context plays an enormous role. A 65% bounce rate might be terrible for an eCommerce homepage; however, that would be fantastic for a blog post ranking for long-tail informational queries. Compare bounce rates to industry benchmarks, historical performances, and specific page purposes. Beyond the raw percentage, it’s the trend that matters: better rates indicate improvement in user experience and content alignment.
Benchmarks for source of traffic also vary. Organic search traffic tends to bounce 40-60%, paid search 30-50%, social media 60-80%, email 20-40%, and direct traffic 20-35%. These ranges are meant to show which channels are underperforming and need more optimization, rather than giving an indication of the site health by a single number.
Adjusted Bounce Rate Formula (Time-Qualified)
Some analysts prefer defining bounces based on session duration:
Adjusted Bounce Rate = (Sessions <10 seconds with 1 page view ÷ Total Sessions) × 100
This stats bounce rate formula filters out legitimate quick visits where users found immediate answers. The 10-second threshold varies by industry—news sites might use 5 seconds while complex B2B sites might set 30 seconds as the engagement threshold.
GA4 Engagement Rate (inverse relationship to traditional bounce):
Engagement Rate = (Engaged Sessions ÷ Total Sessions) × 100
Where engaged sessions are those lasting longer than 10 seconds, having 2+ page views, or triggering conversion events. Since:
Bounce Rate ≈ 100 – Engagement Rate
The relationship isn’t perfectly inverse due to how GA4 defines engagement thresholds, but they’re strongly correlated. Understanding both metrics provides complete visibility into visitor behavior patterns.
Cohort Bounce Rate Analysis Formula
Cohort Bounce Rate = (Bounces from Cohort Z ÷ Total Sessions from Cohort Z) × 100
This advanced application segments users by acquisition date, campaign, or characteristic to analyze how bounce rates change over the customer lifecycle. New visitors might show 70% bounce rate while returning visitors drop to 40%, revealing loyalty patterns.
The mathematical simplicity of the bounce rate percentage calculator belies the complexity of proper implementation. Accurate calculation requires clean data collection, appropriate event tracking, bot filtering, and careful definition of what constitutes meaningful engagement for your specific business model.
Bounce Rate Step-by-Step Example
Let’s walk through a practical Bounce rate calculator using realistic website data. This example demonstrates how a website bounce rate percentage calculator processes actual session information.
Scenario: You run an online fitness blog and want to calculate last month’s bounce rate using your Google Analytics bounce rate calculator data.
Step 1: Gather Session Data
From your analytics dashboard, you extract the following information for March 2026:
- Total Sessions: 45,230
- Single-page Sessions: 24,876
- Multi-page Sessions: 20,354
Step 2: Identify Bounced Sessions
Not all single page sessions qualify as bounces under modern definitions. Review engagement criteria:
- Sessions with 2+ page views: Already categorized as multi-page (20,354)
- Single-page sessions >10 seconds: 8,142
- Single-page sessions with event triggers: 2,418
- True bounced sessions (single page, <10 sec, no events): 14,316
Step 3: Apply the Formula
Using the simple bounce rate calculator approach:
Bounce Rate = (Bounced Sessions ÷ Total Sessions) × 100 Bounce Rate = (14,316 ÷ 45,230) × 100 Bounce Rate = 0.3165 × 100 Bounce Rate = 31.65%
Step 4: Segment by Page Type
The blog bounce rate calculator reveals different patterns across content categories:
Home Page:
- Total Entrances: 12,450
- Bounces: 5,214
- Bounce Rate: (5,214 ÷ 12,450) × 100 = 41.88%
Blog Posts:
- Total Entrances: 28,340
- Bounces: 7,156
- Bounce Rate: (7,156 ÷ 28,340) × 100 = 25.25%
Product Pages:
- Total Entrances: 4,440
- Bounces: 1,946
- Bounce Rate: (1,946 ÷ 4,440) × 100 = 43.83%
Step 5: Analyze by Traffic Source
The marketing analytics bounce rate breakdown shows channel performance:
Organic Search:
- Sessions: 22,115
- Bounces: 5,529
- Bounce Rate: (5,529 ÷ 22,115) × 100 = 25.00%
Social Media:
- Sessions: 11,058
- Bounces: 6,635
- Bounce Rate: (6,635 ÷ 11,058) × 100 = 60.00%
Paid Search:
- Sessions: 6,785
- Bounces: 1,357
- Bounce Rate: (1,357 ÷ 6,785) × 100 = 20.00%
Direct Traffic:
- Sessions: 5,272
- Bounces: 795
- Bounce Rate: (795 ÷ 5,272) × 100 = 15.08%
Step 6: Mobile vs Desktop Analysis
Using a mobile bounce rate calculator approach:
Desktop Sessions:
- Total: 27,138
- Bounces: 7,312
- Bounce Rate: (7,312 ÷ 27,138) × 100 = 26.94%
Mobile Sessions:
- Total: 16,274
- Bounces: 6,088
- Bounce Rate: (6,088 ÷ 16,274) × 100 = 37.41%
Tablet Sessions:
- Total: 1,818
- Bounces: 916
- Bounce Rate: (916 ÷ 1,818) × 100 = 50.39%
Step 7: Compare Against Benchmarks
According to bounce rate benchmarks by industry, fitness and health blogs typically range from 40-60% bounce rate. Your overall 31.65% indicates strong content engagement. However, the 60% social media bounce rate suggests misalignment between social promotions and content expectations.
Step 8: Calculate Improvement Needed
If your goal is achieving a best-in-class 25% overall bounce rate:
Current: 31.65% Target: 25.00% Required Reduction: 31.65 – 25.00 = 6.65 percentage points
With 45,230 sessions and current 14,316 bounces, you’d need to reduce bounces to: Target Bounces = 45,230 × 0.25 = 11,308 Bounces to Convert = 14,316 – 11,308 = 3,008 sessions
This conversion rate calculator logic shows you need to engage an additional 3,008 visitors monthly—achievable by improving mobile experience (higher bounce rate) and refining social media messaging.
Step 9: Time-Based Trend Analysis
Compare against previous month:
February 2026: 38.42% bounce rate March 2026: 31.65% bounce rate Improvement: 6.77 percentage points (17.6% relative decrease)
This session bounce rate calculator data indicates positive momentum from recent site optimizations.
Step 10: Export and Report
Most bounce rate calculator with export functionality generates reports showing:
- Overall metrics with trend comparisons
- Segment breakdowns (page type, traffic source, device)
- Top bouncing pages requiring attention
- Improvement recommendations based on data patterns
This comprehensive example demonstrates how accurate bounce rate calculator tools transform raw analytics data into actionable insights. The step-by-step approach reveals not just what your bounce rate is, but why it occurs and where to focus optimization efforts.
Variables Explanation
Understanding each variable in Bounce rate calculator ensures accurate measurement and meaningful interpretation. These components work together within your visitor behavior calculator to quantify engagement patterns.
Total Sessions
The denominator in your bounce rate formula represents every visit to your website during the measurement period. A session begins when a user arrives and continues until either 30 minutes of inactivity pass (standard timeout), midnight occurs, or the traffic source changes mid-visit. Modern analytics bounce rate calculator tools automatically handle session management, but understanding the mechanics helps explain discrepancies.
Session counting methodology affects results significantly. If someone visits your site at 2:15 PM and remains active until 2:47 PM, that’s one session despite spanning 32 minutes because continuous activity resets the timeout clock. However, if they visit at 2:15 PM, become inactive, and return at 2:50 PM, that’s two sessions because 35 minutes elapsed without interaction.
Cross-device sessions present measurement challenges. Traditional tracking treats visits from mobile and desktop as separate sessions even if by the same person. Advanced user retention analytics platforms using cross-device tracking can unify these, affecting total session counts and bounce calculations.
Bounced Sessions (Single-Page Sessions)
This numerator represents visits where users viewed exactly one page without triggering additional engagement signals. The definition of “bounced” has evolved with analytics platforms. Classic Universal Analytics counted any single-page view as a bounce. Modern GA4 bounce rate changes focus on engagement—sessions under 10 seconds with one page view and no events qualify as bounces.
The engagement threshold significantly impacts what your site performance score calculator considers bounced. Setting a 5-second threshold versus 30 seconds can swing bounce rates by 15-20 percentage points. Industry best practices suggest:
- Blog content: 10-15 second threshold
- eCommerce product pages: 5-10 seconds
- Long-form content: 30-60 seconds
- Video content: Duration-based (25% completion minimum)
Bot traffic and spam referrals inflate bounced session counts artificially. Quality web traffic analytics calculator implementations include bot filtering to exclude automated traffic from calculations. Without filtering, your bounce rate data discrepancies can reach 10-30% inflation depending on site visibility.
Entry Pages (Landing Pages)
When calculating page-specific bounce rates, the landing page bounce rate calculator focuses on where sessions begin. Not all page views serve as entry points—internal navigation doesn’t create new sessions. The formula becomes:
Page Bounce Rate = Bounces from Page ÷ Entrances to Page
A blog post might receive 5,000 total page views but only 2,000 entrances (first page of session). If 800 of those 2,000 entrance sessions bounced, the page bounce rate is 40%, not the 16% you’d calculate using total views.
This distinction matters tremendously for landing page optimization. Pages designed for campaign traffic should be evaluated by entrance bounce rates. Internal pages reached through site navigation have naturally lower bounce rates since visitors already demonstrated engagement by clicking through.
Time on Page / Session Duration
While not directly in the formula, session metrics calculator data on time spent determines whether modern systems classify sessions as bounced. GA4’s 10-second engagement threshold means a user spending 9 seconds reading content and leaving counts as bounced, while 11 seconds doesn’t—even with identical single-page behavior.
Session duration measurement has technical limitations. The final page of any session shows inaccurate time because no subsequent page load provides an end timestamp. Analytics estimates based on JavaScript events (scroll, mouse movement) but can’t perfectly measure reading time without exit engagement.
Events and Interactions
Modern bounce rate tracking issues emphasize event tracking quality. Events include:
- File downloads
- Outbound link clicks
- Video plays
- Form submissions
- Scroll depth milestones
- Element interactions
- JavaScript triggers
A visitor who reads your entire article, clicks an affiliate link, and exits might appear as a bounce without proper event tracking. Implementing comprehensive event monitoring through custom bounce rate script configurations ensures accurate engagement measurement.
The challenge lies in defining meaningful events. Tracking every mouse movement creates data noise. Focus on business-relevant interactions—actions indicating genuine interest or progress toward conversion goals.
Traffic Source
Bounce rate calculator for marketers segments by acquisition source because different channels exhibit varying baseline bounce rates:
Organic Search: Users arrive with specific intent, typically showing 40-60% bounce rates as they evaluate whether content matches search queries.
Paid Search: Tighter keyword targeting and pre-qualified landing pages usually produce 30-50% bounce rates when campaigns align well.
Social Media: Often generates 60-80% bounce rates as users casually browse shared content without purchase intent.
Email Campaigns: Engaged subscribers typically bounce 20-40% when content matches email promises.
Direct Traffic: Returning visitors and brand loyalists bounce 20-35%, showing higher engagement familiarity.
Your digital marketing bounce rate calculator should segment these sources to avoid misleading averages. A site with 50% overall bounce rate might have excellent 25% organic performance but poor 75% social results—requiring different optimization strategies.
Device Type and Browser
Mobile bounce rate calculator data reveals device-specific patterns. Mobile sessions typically bounce 10-20 percentage points higher than desktop due to smaller screens, slower connections, and on-the-go browsing contexts. Tablet bounce rates usually fall between mobile and desktop.
Browser analytics bounce rate variations stem from technical compatibility issues. If certain browsers render pages poorly or load slowly, bounce rates spike for those segments. Cross-browser testing prevents these technical bounce rate tracking issues.
Geographic Location
Regional visitor behavior varies culturally and infrastructurally. A local bounce rate calculator might reveal users from regions with slower internet speeds bounce more frequently due to page load time frustration. Language mismatch also drives bounces when content doesn’t match visitor locale expectations.
Page Load Speed
While not captured in the basic formula, site performance calculator metrics show strong correlation between load time and bounce rate. Pages loading in under 2 seconds average 9% bounce rates. At 5 seconds, this jumps to 38%. Beyond 10 seconds, bounce rates exceed 75%.
Technical performance directly impacts the numerator slow loads increase bounced sessions—making speed optimization critical for bounce rate improvement techniques.
Content Quality and Relevance
Ultimately, bounce rate measures content-audience fit. High-quality content perfectly matching visitor intent achieves low bounce rates naturally. Misalignment between meta descriptions (setting expectations) and actual content (delivering value) drives bounces regardless of technical excellence.
The variables explanation demonstrates that bounce rate extends far beyond simple division. Each component carries nuances affecting interpretation and optimization priorities. Professional analytics bounce rate calculator platforms expose these variables through segmentation, enabling precise diagnosis of engagement challenges and targeted improvement strategies.
Comprehensive Guide to Bounce Rate Calculator Tools and Optimization
Effective digital marketing strategies within the contemporary sphere rely on an understanding of the relationship between consumers and your online presence. The advanced bounce rate calculator designed for SEO experts has transformed from calculating percentages to an advanced analytics system, which offers an array of user behavior, content, and conversion pathway trends. This extensive section covers advanced strategies, implementation specifics, optimal strategies, etc.
Advanced Analytics Platform Integration
Professional grade website bounce rate calculator tools are easily integratable with professional analytics architectures. The current standard website analytics tool is Google Analytics 4, but GA4 website bounce rate calculator tool differs significantly from its predecessors, Google Analytics Universal. GA4 eliminated the concept of bounce rate and instead holds web analytics practitioners to utilize engagement rate.
The shift to GA4 brought forth analytics errors in the data on bounce rates by organizations that were unprepared to adapt to the change in methodology. Universal Analytics identifies sessions or sessions with bounces containing one or more page views. GA4 has taken a completely opposite view. The engagement rate in GA4 identifies sessions with a duration of over 10 seconds or two or more page views or even conversion events. Bounce rate is just the opposite.
Essentially, this is a definitional change, implying that the typical range of GA4 bounce rate change against Universal Analytics for the same traffic is 10-30 points. Thus, a blog that recorded 50% Universal Analytics might record 35% GA4, with the extended reading engagement possibly contributing to the result despite the one-page views.
Advanced integrations of the bounce rate API tool programmatically pull data into custom dashboards and automate reporting. With the Google Analytics Data API, one can enable real-time monitoring of bounce rates, alerting systems when thresholds are surpassed, and integrate with business intelligence platforms like Tableau, Power BI, or other custom-built solutions. API access allows for the automation of bounce rate reports, eliminating manual data extraction and allowing performance visibility instantly.
Data Studio’s Bounce Rate Visualization, now Looker Studio, transforms raw metrics into executive-friendly dashboards. Then, through custom templates, it displays how bounce rate trends over time, segment comparisons, traffic source performance, and page-level heatmaps highlight the content that contributes to high bounces. With interactive filters, stakeholders can explore dimensions of the data without knowing analytics.
Adobe Analytics gives enterprise-scale bounce rate software featuring advanced segmentation, pathing analysis, and predictive modeling. Different from Google’s platform, Adobe offers complete customization of the definitions of bounces, allowing businesses to set up industry-specific engagement thresholds. For instance, financial services might define a bounce as a session under 45 seconds, where news publishers may be at 15 seconds.
The integration of bounce rate for specialized SEO tools is visible on platforms such as SEMrush, Ahrefs, Moz, etc. By combining the element of Bounce Rate with tools including keyword rankings, backlinks, and competitor analysis tools, web developers can identify the connection between increased Bounce Rate and a possible reduction in rankings. SEO performance tool suites allow for comprehensive optimization that includes both technical and content-driven SEO elements.
Platform-Specific Calculator Implementations
Various content management systems and e-commerce sites make use of different types of bounce rate tracking tools that need to be customized accordingly. WordPress is the leading platform for website creation; thus, WordPress bounce rate plugin calculator options are significant for tracking the bounce rate on the platform. Some examples are MonsterInsights, ExactMetrics, and Analytify, which help in integrating Google Analytics and provide the calculation of the bounce rate on the WordPress dashboard itself.
These kinds of plugin solutions for bounce rate calculator provide additional features. Bounce rate by author enables users to see which authors produce the most engaging content. It identifies top traffic pages with extremely high bounce rates in need of urgent attention. It also monitors the bounce rate of specific categories, tags, or post types of choice.
The needs for a Shopify bounce rate calculator will be different for a content site because the metrics used for an eCommerce site will focus on conversion rather than a general “engagement.” A Shopify eCommerce store owner needs to track bounce rates for different pages, such as products, collections, and even landing pages. If there is a high bounce rate for products, it might be related to the price of the products, the images, and even the descriptions.
The eCommerce bounce rate calculator goes beyond percentages into revenue impact. To estimate revenue loss resulting from bounces, multiply the number of bounced sessions by the average order value and historic conversion rate: Lost Revenue = Bounces × AOV × Conversion Rate. A store receiving 10,000 monthly bounces at $85 AOV and a 2.5% conversion rate would lose $21,250 every month due to bounce-driven abandonment-quantifying the financial imperative for reduction.
Custom implementation of a web app bounce rate calculator would use JavaScript tracking libraries such as Segment, Mixpanel, or Amplitude. These event-driven platforms offer greater flexibility compared to page view-centric Google Analytics by enabling you to define what constitutes meaningful engagement for SPAs, PWAs, and other interactive tools with precision.
Single-page applications built with React, Vue, and Angular require special bounce rate tracking due to the fact that traditional page views are not occurring. Instead, SPAs rely on virtual page views or route change events to simulate the navigation of pages. If not implemented correctly, SPAs either report artificially low bounce rates-they navigate within the app, and analytics consider it one continuous page view-or artificially high rates, whereby every internal navigation starts a new session.
Server-side calculation of the Bounce Rate offers an option for sites which require absolute accuracy in Bounce Rate calculations and where sites experience problems due to the presence of ad blockers. It also allows sites to track individual page requests using the “session management cookie” approach used in many server-side applications. As the approach does not use JavaScript, it will track 100% of users’ traffic regardless of whether they have JavaScript enabled or disable ad blockers from running on the site.
Platform Specific Calculator Implementations
As the tool compares acquisition channels, there are core bounce rate differences to address. For instance, organic search traffic has diverse quality based on the keyword type used. Branded keywords, which are searches for your company, yield a 15-25% bounce rate. On the other hand, general keywords with high volume tend to yield 60-80% bounces.
The number of bounces usually falls between the two extremes, at the rate of 35 to 50 percent. It may be argued that long-tail keywords, despite their relative lack of search volume, show intent that can be fulfilled by content that is optimally created, thus reducing the overall bounce rate. SEO tips regarding bounce rate include the content’s depth vis-à-vis the keywords searched.
Paid search bounce rate directly influences the Quality Score and cost per click. In fact, a higher paid search bounce rate may result in a lower Quality Score, which will increase ad bid costs or even decrease the ad’s ability to be displayed. A paid search bounce rate below 40 percent for paid landing pages may require a message match strategy for the ad copy to match the landing page headlines.
The marketer’s bounce rate calculator segments the paid campaigns by match type, showing performance patterns. Typically, exact match keywords bounce 25-35%, phrase match 35-50%, and broad match 50-70%. This can help inform bids and negative keyword development accordingly. If there are high bounces on broad match, it may indicate that the query/contents align poorly, which in turn requires applying tighter match restrictions or adding negative keywords.
Social media bounce rates have a reflection of casual browsing habits of the people on these sites. Facebook referrals generally bounce around 65-75%, Instagram 70-80%, Twitter 60-70%, and LinkedIn 50-60% for B2B content. These high rates don’t necessarily equate to failure-social traffic often serves brand awareness and top-of-funnel purposes rather than immediate conversion.
Social bounce rate optimization relies on creative-content alignment. When the promoted posts tout specific benefit(s), it’s their landing pages that must produce value immediately. The disconnect between social creative and the landing experience is what drives bounces. Friction is reduced and engagement improved by native content formats: carousels that match the ad imagery to the landing page imagery, video ads with landing page video continuations, or collection ads leading to a product gallery of items featured in the ad.
Email campaign bounce rates also significantly depend on the quality of the lists and the relevance of their contents.Promotion emails to subscribers usually bounce 20-30%. Re-engagement campaigns targeting users who have gone inactive may have bounces as high as 50-70%. Newsletter traffic bounces anywhere from 25-40%, depending on the quality of the content and the user’s intention for subscribing.
Email segmentation helps one improve email bounce rates. Personalization, based either on past behavior or demographics, or even purchase history, manages to reduce bounces by as much as 15-25%, compared to generic blasts. This includes testing subject lines and preview text against each other to ensure the expectations set match the content at the destination landing page, the primary driver of bounces in email traffic.
Referral traffic bounce rates vary wildly depending on the quality of the source. Links from authoritative industry publications tend to bounce around 30-45% due to the readers arriving with actual interest in the topic. Links from forums might bounce anywhere between 60-80% due to casual clicking. Analyzing referral bounce rates finds partnership opportunities in low-bounce referrers worth nurturing, as well as poor-quality backlinks worth disavowing.
Bounce rates from direct traffic are typically a sign of brand loyalty and familiarity with the site from previous visits. If the bounce rate is under 30 %, it means that the people visiting the site again know exactly what they are looking for and have navigated the site accordingly. Increasing bounce rates for direct traffic could be a signal that the homepage is suffering from problems in navigation.
Device and Browser Optimization
Mobile-first indexing makes mobile bounce rate calculator data critically important. Because of smaller screens, slower connections, and touch navigation challenges, not to mention distracted browsing contexts, mobile sessions tend to bounce 10-20% points higher than desktop on average. Sites demonstrating desktop bounce rates in the vicinity of 35% routinely show mobile rates approaching 50%.
Responsive design alone won’t guarantee low mobile bounce rates. True mobile optimization involves thumb-friendly tap targets, minimum 44×44 pixels, single-column layouts with no horizontal scrolling, above-the-fold value propositions visible without scrolling, and fast load times less than 3 seconds on 3G connections. The real identification of friction points driving bounces occurs through mobile-specific testing by means of Google’s Mobile-Friendly Test, PageSpeed Insights mobile scores, and real-device testing.
AMP implementations have a tendency to drop mobile bounce rates 5-15% due to near-instant load times. AMP adoption has been eased by improvements in Core Web Vitals, but it remains unarguably useful for news, blog, and content-heavy sites where speed can be critical in driving engagement. For this, the trade-off will be minimized functionality and designing considerations that have to be weighed against the improvement in bounce rate.
Progressive Web App features enhance mobile engagement through app-like experiences. Add-to-home-screen functionality, offline access, and push notifications encourage repeat visits with lower bounce rates. PWAs combining fast load times, smooth interactions, and native-feeling navigation reduce mobile bounces 10-20% compared to standard responsive implementations.
Browser bounce rate variations reveal technical compatibility issues. If Chrome users bounce 35% but Internet Explorer users bounce 65%, browser-specific bugs likely exist. Cross-browser testing tools like BrowserStack identify rendering problems, JavaScript errors, and functionality breaks driving these discrepancies.
Browser market share informs optimization priorities. Chrome dominates with 65%+ market share, followed by Safari at 20%, Firefox at 5%, and Edge at 4%. Optimizing for Chrome and Safari captures 85%+ of traffic, while IE/Edge testing prevents issues for the remaining segments. Testing should occur across versions Chrome 110, Safari 16, Firefox 110 as older versions may behave differently.
Connection speed segmentation helps reveal another aspect of performance. For fiber connections, users don’t usually bounce due to speed considerations. Conversely, mobile 3G network users quickly drop pages they find to be loading slowly. The availability of analytics tools that present data on bounce rate by connection types (often provided in custom dimensions that include navigator.connection.effectiveType) helps inform optimization strategies based on mobile network performance.
Content Type and Page-Specific Strategies
Blog bounce rate benchmark expectations vary by content type. How-to articles and tutorials typically bounce 40-55% as users seek specific procedural knowledge and leave once informed. Listicles bounce 45-60% depending on depth and internal linking encouraging exploration. Opinion pieces and analysis bounce 35-50% when controversial or engaging, higher when generic.
Reducing blog bounce rates requires strategic internal linking. Each article should include 3-5 contextual links to related content, positioned naturally within paragraphs rather than in isolation. Sidebar recommendations, “related posts” widgets, and inline content upgrades (downloadable resources in exchange for email) provide additional engagement paths beyond organic linking.
Content depth affects bounce rates non-linearly. Articles under 300 words bounce 60-80% due to insufficient value. The 500-800 word range reduces bounces to 50-65%. Comprehensive 1,500-2,500 word guides achieve 35-50% bounces by thoroughly addressing topics. Beyond 3,000 words, bounces may increase again if readers feel overwhelmed—requiring table of contents navigation and scannable formatting.
Landing page bounce rate calculator metrics for campaign destinations require different evaluation. High-converting landing pages might bounce 70-90% because visitors either convert immediately (form submission, purchase, download) or leave quickly when uninterested. What matters is conversion rate, not bounce rate. A 85% bounce rate with 8% conversion rate far outperforms 50% bounce rate with 2% conversion.
Multi-step forms reduce landing page bounces by creating page views through progress tracking. Instead of single-page contact forms, multi-step implementations ask basic information first (name, email), then detailed questions (company, budget, timeline). Each step generates a page view or virtual page, dramatically reducing measured bounce rate while potentially improving completion through psychological commitment escalation.
Product page bounce rate optimization focuses on purchase friction reduction. High-quality product photography from multiple angles reduces uncertainty bounces. Detailed specifications, size guides, and comparison charts address information-seeking bounces. Customer reviews and trust signals (security badges, return policies, guarantees) overcome credibility bounces.
The eCommerce bounce rate calculator should segment by product category because acceptable rates vary. Electronics and appliances bounce 25-35% as shoppers research specifications across sites. Fashion and accessories bounce 40-55% due to aesthetic preferences and comparison shopping. Digital products and software bounce 20-30% when targeting matches well.
Service page bounces correlate with call-to-action clarity. Pages with multiple competing CTAs (call, email, schedule, chat) often bounce higher than focused single-action pages. Directional cues—arrows pointing to forms, contrasting button colors, whitespace isolation—reduce bounces by guiding attention toward desired actions.
FAQ and support content naturally shows higher bounces (60-80%) because users seek specific answers and leave satisfied. This isn’t problematic if the content serves its purpose. Tracking on-page search queries and navigation patterns reveals whether high bounces indicate success (found answer) or failure (didn’t find answer).
Technical Performance and Core Web Vitals
Page load speed represents the strongest technical factor influencing bounce rates. Google research shows bounce probability increases 32% as page load time goes from 1 to 3 seconds. At 5 seconds, bounce probability increases 90%. Beyond 10 seconds, 123% increase occurs as frustrated users abandon before content appears.
Core Web Vitals directly impact both bounce rates and search rankings. Largest Contentful Paint (LCP) measures loading performance—target under 2.5 seconds. Pages loading LCP in under 1.5 seconds bounce 15-20% less than those requiring 4+ seconds. Optimizing images (compression, lazy loading, modern formats), minimizing JavaScript blocking, and utilizing content delivery networks improve LCP.
First Input Delay (FID) measures interactivity—target under 100 milliseconds. High FID frustrates users attempting clicks or taps that don’t respond immediately, driving abandonment. Minimizing JavaScript execution time, code splitting to load only necessary scripts initially, and deferring non-critical resources reduce FID.
Cumulative Layout Shift (CLS) measures visual stability—target under 0.1. Pages where content jumps as fonts load, images render, or ads appear create jarring experiences driving bounces. Setting explicit width/height attributes on images and videos, reserving space for ads, and preloading fonts prevent layout shifts.
Server response time (Time to First Byte) affects perceived speed even before content loads. TTFB above 600ms creates frustration despite eventual content quality. Upgrading hosting infrastructure, implementing server-side caching, optimizing database queries, and using CDNs reduce TTFB.
Browser caching strategies reduce bounce rates for returning visitors by eliminating redundant downloads. Properly configured cache headers allow browsers to store static assets (images, CSS, JavaScript) locally, dramatically accelerating subsequent page loads. Return visitors often bounce 20-30% less than first-time visitors partially due to caching advantages.
Image optimization provides the highest-impact performance improvement for most sites. The average webpage now exceeds 2MB with images comprising 50-60% of that size. Compressing images through tools like TinyPNG or Squoosh, implementing responsive images (srcset attributes serving appropriate sizes per device), and adopting modern formats (WebP, AVIF) reduce payload significantly.
Bounce Rate Improvement Checklist and Action Plan
Implementing comprehensive bounce rate optimization requires systematic audit and improvement processes. This bounce rate improvement checklist guides prioritization:
Technical Foundation (Weeks 1-2):
- Audit page load speeds using PageSpeed Insights and GTmetrix
- Optimize Core Web Vitals (LCP, FID, CLS) to green thresholds
- Implement comprehensive browser and device testing
- Fix mobile responsiveness issues and touch target sizes
- Configure server-side caching and CDN distribution
- Compress and optimize all images (WebP/AVIF formats)
- Minimize JavaScript and CSS file sizes
- Implement lazy loading for below-fold images
Content Relevance (Weeks 3-4):
- Audit high-bounce pages for content-query alignment
- Rewrite meta descriptions ensuring accurate expectations
- Strengthen headlines and introductions with hooks
- Add comprehensive content addressing related user questions
- Implement FAQ sections answering common objections
- Develop comparison tables for evaluation-stage content
- Create clear value propositions above the fold
- Remove thin or outdated content without value
User Experience (Weeks 5-6):
- Redesign navigation for intuitive information architecture
- Implement internal linking recommendations in content
- Add related content widgets to all pages
- Create clear call-to-action elements with directional cues
- Test and optimize form designs for conversion
- Implement exit-intent popups strategically
- Develop mobile-specific layouts prioritizing thumb zones
- Add trust signals (testimonials, security badges, credentials)
Analytics and Testing (Ongoing):
- Set up custom segments tracking bounce patterns
- Create automated reports alerting to spike changes
- Implement heatmap and session recording tools
- Develop A/B testing roadmap for high-bounce pages
- Track cohort behavior over time
- Monitor device, browser, and geographic segments
- Analyze user journey funnels identifying drop-off points
- Measure revenue impact of bounce rate changes
Content Strategy (Ongoing):
- Identify high-traffic, high-bounce pages for optimization
- Develop content upgrade paths from top-performing pages
- Create comprehensive guides for competitive keywords
- Build internal linking structures around content pillars
- Develop multimedia assets (videos, infographics, tools)
- Implement content personalization based on traffic source
- Refresh dated content with current information
- Expand thin content lacking comprehensiveness
Bounce rate optimization represents continuous improvement rather than one-time fixes. Market changes, algorithm updates, and evolving user expectations require ongoing monitoring and adaptation. Establishing quarterly audits, monthly performance reviews, and real-time alerting for anomalies maintains healthy engagement rates over time.
The intersection of technical performance, content relevance, and user experience creates optimal bounce rate outcomes. Focusing solely on one dimension while neglecting others produces marginal improvements. Holistic strategies addressing all three simultaneously generate compounding benefits—fast-loading pages with highly relevant content and intuitive navigation achieve dramatically lower bounce rates than any single optimization in isolation.
Modern SEO demands user-centric optimization where bounce rate serves as a primary diagnostic metric. Sites satisfying user intent with fast, relevant, engaging experiences naturally achieve both low bounce rates and high search rankings. The metrics don’t drive optimization user satisfaction does. Bounce rate simply measures success at delivering that satisfaction, guiding refinements that benefit both search visibility and business results.
Frequently Asked Questions
What is a good bounce rate percentage?
Bounce rate benchmarks vary radically depending on industry, content type, and traffic source. There is no single “good” rate; general guidelines place your metrics in perspective. Content websites and blogs usually have 40-60% bounce rates, because many visitors find what they’re looking for within a single article. eCommerce sites tend to average 20-45% due to the fact that product browsing requires multi-page navigation. The bounce rates of landing pages, being very campaign-specific, could fall in the range of 60-90%, because visitors convert right then and there or leave. High bounce rates are acceptable since conversion goals are usually achieved.
Service-based business sites typically have 30-50% because they’re giving equal weight to information and paths to conversion. News and media sites are anywhere between 40-70% depending on the depth of an article and how well the related content is presented. The dictionary, reference, and FAQ sites are naturally going to be high, at 60-80%, because users are visiting with a specific question and leaving once they have an answer.
Context plays an enormous role. A 65% bounce rate might be terrible for an eCommerce homepage; however, that would be fantastic for a blog post ranking for long-tail informational queries. Compare bounce rates to industry benchmarks, historical performances, and specific page purposes. Beyond the raw percentage, it’s the trend that matters: better rates indicate improvement in user experience and content alignment.
Benchmarks for source of traffic also vary. Organic search traffic tends to bounce 40-60%, paid search 30-50%, social media 60-80%, email 20-40%, and direct traffic 20-35%. These ranges are meant to show which channels are underperforming and need more optimization, rather than giving an indication of the site health by a single number.
How do I calculate bounce rate manually?
Manual bounce rate calculation requires accessing your analytics platform’s session data. First, log into Google Analytics, Adobe Analytics, or your chosen platform and navigate to the Behavior or Engagement section. Select your desired date range—last 7 days, 30 days, or custom periods for specific analysis.
Export two critical numbers: total sessions and single-page sessions (bounces). In Google Analytics Universal, find these under Audience > Overview. For GA4, navigate to Reports > Engagement > Pages and screens, then filter by landing pages and note engaged versus non-engaged sessions.
Apply the formula: Bounce Rate = (Total Bounced Sessions ÷ Total Sessions) × 100. For example, with 5,000 total sessions and 2,250 bounces, calculate 2,250 ÷ 5,000 = 0.45, then multiply by 100 = 45% bounce rate.
For page-specific calculations, identify individual page entrances rather than total sessions. If a blog post received 1,200 entrances and 540 resulted in immediate exits, the calculation is 540 ÷ 1,200 × 100 = 45% page bounce rate.
Segment calculations by traffic source by filtering analytics data before extraction. Calculate bounce rate calculator separately for organic, paid, social, and referral traffic to identify channel-specific performance patterns. Mobile versus desktop segmentation follows the same process—filter by device category, extract session and bounce data, then apply the formula.
Advanced manual analysis incorporates time thresholds. Count only sessions under 10 seconds with single-page views as true bounces, excluding brief but engaged visits. This requires more detailed data extraction showing both session duration and page view counts.
What's the difference between bounce rate and exit rate?
The exit rate and bounce rate are measures of different, though related, phenomena. The bounce rate measures the activity of visitors who have made a session out of different individual visits to the same page, without visiting other pages. It is typically computed as bounces from the page divided by total entrances to the page. The exit rate, on the other hand, measures the proportion of page views made before exiting the site, computed as the exits from the page divided by the total views of the page.
The big difference: bounce rate is only used with landing pages, while exit rate can be used with any page. A page can have a high exit rate but a zero bounce rate if everyone entered the page through internal pages and exited the page. Conversely, landing pages might have high bounce rates and low exit rates if people enter the page but leave through internal pages.
Consider a blog post example. The article receives 1,000 entrances (landing sessions) with 600 immediate bounces, creating a 60% bounce rate. Additionally, 400 visitors reached it through internal links and 150 of those exited from it. Total views equal 1,400 (1,000 entrances + 400 internal), with 750 total exits (600 bounces + 150 internal exits), producing a 53.6% exit rate.
Bounce rate shows the content-query alignment and effectiveness of the first impression. High bounce rates in landing pages give signals about problems in initial engagement: misleading titles, poor load times, or misplaced content expectations. Exit rate shows where visitors naturally conclude their journey, which isn’t inherently negative if they have completed desired actions first.
Strategic interpretation varies. High bounce rates are always worth investigating on landing and campaign destination pages. High exit rates require context: Conversion funnel pages should have low exits, but thank-you pages naturally show 100% exit rates after completion of the goal. Blog posts may acceptably show high exits after providing complete answers to the reader’s question.
Bounce rate will help in the optimization of entry experiences and acquisition of traffic. The exit rate would be used in identifying content gaps, improving internal linking, and enhancing the effectiveness of the conversion path. Together, they provide comprehensive session behavior insights.