
Average Percentage Calculator
What Is Average Percentage?
An Average Percentage is the Mean (Arithmetic) of Two or More Percent Values. A Statistical Calculation; Average Percentage Indicates “the Central Tendency” of (A Set of) Percent Figure(s) These Could be High School Test Scores, Profit Margins, Attendance Rates, and/or Survey Results.
In Simple Terms, It Answers the Question “Which Single Percentage Represents the Entire Set of Percent Values?”
Example: If One Student has Test Scores of 70% in Subject 1, 85% in Subject 2, and 90% in Subject 3 – Then The Average Percentage would be – ( 70 + 85 + 90 ) ÷ 3 = 81.67% – and therefore Represents the Overall Academic Performance of the Student, Across All Subjects.
All Average Percentages Are Not Created Equal, A Simple Average Works When All the Values Carry Equal Importance/Value However, When Average Percentages Have Different Sample Sizes, Like 70% Out of 50 Questions versus 85% Out of 200 Questions, The Use of a Weighted Average Will Provide a Much More Honest and Accurate Representation of the Data.
The Average Percentage Formula
Simple (Unweighted) Formula
Use this when all percentages are based on equal or comparable totals:
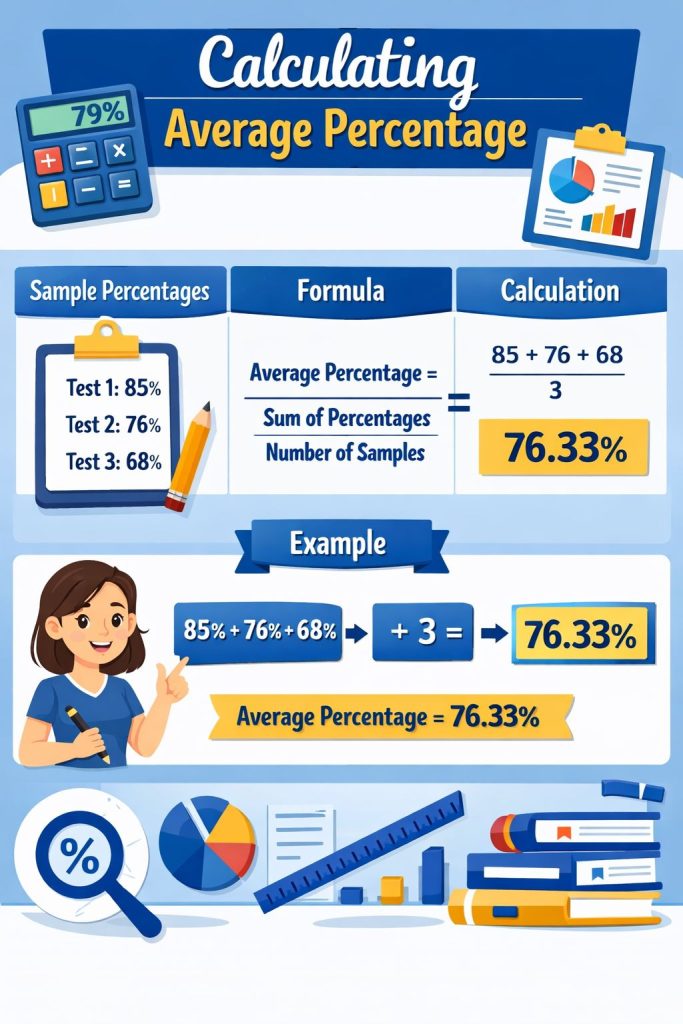
Average Percentage = (P1 + P2 + P3 + … + Pn) / n
Where P1, P2 … Pn are the individual percentages and n is the total count of values.
Weighted Average Percentage Formula
Use this when each percentage comes from a different sample size or carries different importance:
Weighted Average % = (P1*W1 + P2*W2 + … + Pn*Wn) / (W1 + W2 + … + Wn)
Where W1, W2 … Wn are the weights such as total marks, sample size, or credit hours.
Step-by-Step Calculation Guide
Method 1: Simple Average (Equal Weights)
Method 1: Simple Average (Equal Weighting)
1. List all the percentage values you want to average.
2. Add together all of the values.
3. Divide sum of values by total number of values.
4. Round answer to two decimals, if needed.
Example: A student has received: (72%), (68%), (84%) and (76%).
Sum of the Values = 72 + 68 + 84 + 76 = 300.
Total Number of Values = 4.
Average = (300 / 4) = 75%.
Method 2: Weighted Average (Different Sample Sizes)
5. Note the percentage and total marks or sample size for each value.
6. Multiply each percentage by its weight.
7. Sum all the weighted values.
8. Divide by the total of all weights.
Example: A student scores 60% on a 50-mark paper and 80% on a 150-mark paper.
Subject | Score % | Total Marks (Weight) | % x Weight |
Paper A | 60% | 50 | 3000 |
Paper B | 80% | 150 | 12000 |
Total | – | 200 | 15000 |
Weighted Average = 15000 / 200 = 75%
Compare that to a simple unweighted average: (60 + 80) / 2 = 70%. The weighted result is more accurate because Paper B carried three times the marks.
Practical Examples Across Different Fields
Academic: Average Percentage of Marks
A student has achieved scores of 65%, 72%, 80%, 55% and 78% across 5 subjects. The average subject score is calculated as follows: (65 + 72 + 80 + 55 + 78) / 5 = 70%. Therefore, regardless of subject difficulty, this information tells a parent, teacher or student how an overall performance is displayed through an average subject score across all subjects.
Using the same approach for semester average percentage, if some subjects have a different number of credit hours, then use the weighted mean percentage average of marks for a more accurate cumulative average marks for each semester by subject.
Business and Finance: Sales Growth and ROI
A company has reported 4% 7% -2% 9% and 3% monthly sales growth percentages over the 5 months. An average monthly sales growth percentage over these 5 months is calculated to be (4% + 7% – 2% + 9% + 3%)/5 = 4.2%. This number provides analysts and businesses with information to forecast sales revenue on an annual basis as well as to compare performance against competitors.
To calculate average percent return on investments, add each return for the number of periods and divide by the number of periods. For those who wish to compare their investments long term, a compound annual percentage return calculation like CAGR allows them to have a more accurate estimate on long term rates of growth or potential earnings.
Surveys and Research
If 60% of survey responders in Group A agree to a statement and 75% of survey responders in Group B agree to the same statement, the average percentage of agreeance will depend on the size (existence) of each group. If both groups were the same size, then the average would be (60 + 75)/2 = 67.5%. However, if Group A is half as large as Group B, then the average would be (60%1 + 75%2)/(1 + 2) = 70%. Being able to distinguish between average or typical rater percent in a survey is critical in any serious analysis concerning survey averaging.
How to Calculate Average Percentage in Excel
Basic Average
For cells B2 to B6, all containing percentages, put the following formula: =AVERAGE(B2:B6). Excel will correctly calculate both decimal-based percentages such as 0.75 which represent 75%, and whole numbers as well.
Weighted Average in Excel
For column B containing percentages and for column C containing weights, use the formula =SUMPRODUCT(B2:B6,C2:C6)/SUM(C2:C6). This formula provides a standard method of calculating weighted average percentage values in Excel. the syntax of the formula is identical in both Google sheets and excel. To use this method, each percentage value is multiplied by its weight, all products are added together, and the sum is divided by total weight.
Simple Average vs. Weighted Average: When to Use Which
Criteria | Simple Average | Weighted Average |
Sample sizes | Equal or similar | Unequal (different totals) |
Use case | Equal-weight exams | Multi-credit courses, mixed data |
Complexity | Add and divide | Multiply then divide |
Accuracy | Good when weights are equal | More accurate with unequal weights |
Best example | 5 equal-mark exams | Grades with different credit hours |
Commonly asked question: Is average percentage and mean one in the same? Yes, an Average Percentage is the arithmetic mean of percentage values. Thus, Average Percentage and Mean are interchangeable terms in both academic and statistical usage.
Common Mistakes When Averaging Percentages
When you see these sorts of errors in most analysts’ work, it usually means that there is a problem with data being used to calculate the average percentages of things. The following point highlights the average percentage of two things if one percentage is used and one percentage is not:
- There is no proper use of averaging when trying to average using unequal sample sizes without appropriately weighting them. For example, if 10 people out of 10 had an 80% preference and 1000 people had a 20% preference (Option A), the real average will not be found it will ultimately be about 21% rather than 50%.
- Average percentage cannot be calculated using different bases of percentages, i.e., you cannot use the percentage of revenue of the company against the percentage of the company’s headcount to calculate an average percentage.
- Negative percentages cannot be ignored; negative percentages are also real figures; therefore, include -5% within the total sum.
- Rounding values will also create issues when calculating average percentages. If you average by rounding your individual numbers, then that will create additional errors; only round after your calculations have been completed.
- Average percent change is frequently confused with the compound growth rate, resulting in further compounding issues when averaging; when calculating multi-year averages, using the compound annual growth rate would be more appropriate than using an average percentage value for multi-year analysis.
- When calculating averages, 0s cannot be omitted since zero counts as part of the calculation; if you exclude zero from the calculation’s denominator, you will artificially inflate the average.
Uses and Benefits:
Academic Applications
- The Average Percentage of Combination of All Grades, Report Cards, and Marksheets.
- The College GPA Average Combined Percentage of All Grades Each Semester.
- The Average Percentage of Subject Performance Across All Students in Class
- Used to determine the average of the cohort’s Board Examination Results
Commercial and Financial Uses
- Determine the average growth rate (as a percent) of your monthly or yearly revenue.
- Determine the average profit (as a percent) earned through each of your products or by region.
- Determine the average conversion rate (as a percent) of your marketing campaigns.
- Determine the average performance (as a percent) of each of your employees in all departments.
- Determine the average interest (as a percent) that you will earn on your loans or other investments.
Statistical and Research Uses
- Determine the average (as a percent) of all demographic groups who answered a survey and analyzed their responses.
- Determine the average (as a percent) of your testing results that had errors (average accuracy) and had errors that could have been avoided.
- Determine the average (as a percent) of all website visitors who completed conversions over time; determine the average (as a percent) of all new visitors who engaged with your website over time.
- Determine the average (as a percent) of all students completing programs and the average (as a percent) of all students remaining in a program.
How to Calculate Average Percent Change Over Time
Example: Year 1 sales increased by 10%, Year 2 sales decreased by 4% and Year 3 sales increased by 8%.
Average Percent Change = (10 – 4 + 8) / 3 = 4.67% Average percent change provides a quick reference to the trend direction.
Compound average percent for investment performance reporting or future growth projection. CAGR = (end value / start value) ^ (1/n) – 1 use arithmetic average percent for simple trends; use CAGR for compounded over years.
Frequently Asked Questions
Q. What is the formula for average percentage?
The basic calculation formula is : Average % = Sum % / No. of records. If the sample sizes are not the same, the calculation is calculated with the weighted average, Weighted Average % = Sum( % x Weight) / Sum(Weights).
Q. Can you average percentages directly?
Yes; as long as all the sample sizes in the percentage have the same size or the same basis or type of samples, then the percent values can be directly averaged. If the sample sizes are significantly different, direct averaging provides you with an inaccurate result, so ensure that if your average percentages need to be a weight average.
Q. How do I calculate average percentage of marks for 5 or 6 subjects?
You add the percentage values for each subject that you have (e.g. S1 + S2 + S3 + S4 + S5) divided by the number of Subjects that you have (e.g. 5). If the subject values or grades are weighted differently (e.g. different credit hours), you must multiply the final grade or score for each subject you have by its weight and then sum them together and divide the total by the total of all the subject credits.
Q. Is average percentage the same as mean percentage?
Q. When should I use a weighted average percentage?
Use this metric when all of your data points do not have the same number of observations; for example, when your class sizes, course credit hours, sample sizes, or timeframes differ in terms of how many data points there are for each point. If your data points were equal in size across the board, the average for every group would be extremely accurate, however.